
What fees do to a result
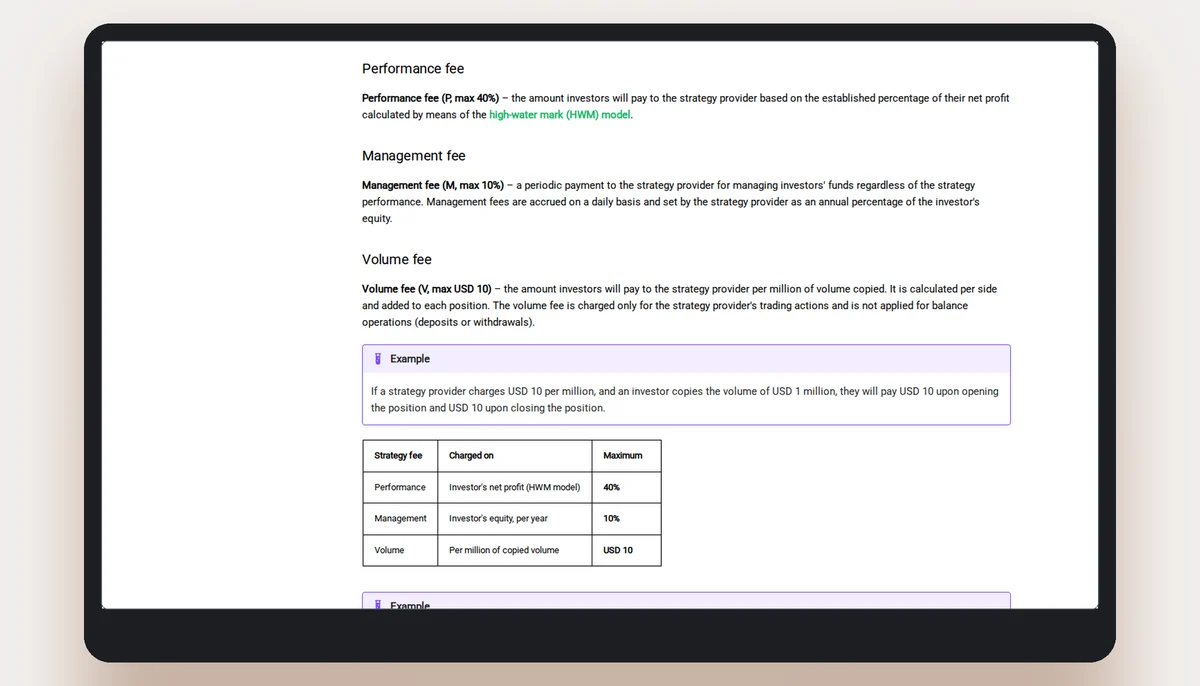
A provider's printed return is measured before the investor's fees on the provider's own account; the follower's account pays them. The fees page of cTrader Copy gives one worked example. This page takes it from gross to net, then changes only the rates to the printed ceilings. The card list shows no fee for any of the 20 cards, so no card's fee drag is stated; what follows is how the fee types work on a result.
Three fees, three bases
The performance fee takes a percentage of the investor's net profit by the high-water mark model, with a printed maximum of 40%. The management fee takes a percentage of equity a year, accrued daily, "regardless of the strategy performance", up to 10%. The volume fee takes up to USD 10 per million of volume copied, per side. Each acts on a different thing, so the same strategy can look different to two followers whose allocations, holding times or sizes differ.
The help page's example, from gross to net
Inputs are the page's: USD 1,000 allocated, performance fee 10%, management fee 5%, volume fee USD 5 per million, USD 700 net profit. The page does not say how long the profit took, so the last two rows put one full year of management fee beside it and are arithmetic, not a case. Source: help.ctrader.com/ctrader-copy/fees-calculation, read on 6 November 2026.
| Line | Working | USD | Share of the USD 1,000 |
|---|---|---|---|
| Net profit before the investor's fees | page's figure | 700 | 70.0% |
| Performance fee | 700 × 0.10 | 70 | 7.0% |
| Management fee for one year | 1,000 × 0.05 | 50 | 5.0% |
| Left after those two fees | 700 − 70 − 50 | 580 | 58.0% |
| Volume fee on one lot of EURUSD, opened and closed | 1.19 × 100,000 ÷ 10^6 × 5 × 2 | 1.19 | not a share of the allocation |
Reading the first table
On the page's inputs the two fees together take USD 120, 12.0% of the allocation, out of USD 700 of profit. That is 17.1% of the profit. The volume fee is separate and is worked per lot. The page presents these numbers to show a calculation; it does not say they are typical, and this site does not either.
The same allocation at the printed caps
Same USD 1,000 and USD 700 of profit; only the rates are changed to the maxima printed on the fees page. Arithmetic on printed ceilings, not a statement that any strategy charges them. Read on 6 November 2026.
| Line | Rate | Working | USD |
|---|---|---|---|
| Performance fee at the cap | 40% | 700 × 0.40 | 280 |
| Management fee at the cap, one year | 10% | 1,000 × 0.10 | 100 |
| Volume fee at the cap, one lot round trip | USD 10 per million | 1.19 × 100,000 ÷ 10^6 × 10 × 2 | 2.38 |
| Left after performance and management fees | 700 − 280 − 100 | 320 |
Why the caps are in a separate table
A cap is a ceiling the platform allows a provider to set, not a rate that anybody charges. The second table exists to show how far the same profit can be moved by the rate alone, from USD 120 to USD 380 out of USD 700. Which rate a given strategy uses is on the Start copying button, and this site cannot read it.
A year with no profit
The definitions applied to a year in which the net profit is zero or negative. The performance fee is a percentage of net profit by the high-water mark model; the management fee is charged on equity whatever the result.
| Net result of the year on USD 1,000 | Performance fee | Management fee at 5% | Change in the account before the volume fee |
|---|---|---|---|
| + USD 0 | USD 0 | USD 50 | − USD 50 |
| − USD 100 | USD 0 | USD 50 | − USD 150 |
Management fee and the break-even
A management fee of 5% a year on USD 1,000 is USD 50 a year, which is USD 0.14 a day on the page's arithmetic. So, in a year with no other charges, an account has to gain USD 50 before the management fee alone is covered. That is the definition applied to a stated rate, not a forecast; the fee is accrued on equity, which changes as the account does, so the exact figure moves.
The volume fee grows with the size copied, not with the result
Arithmetic of the page's rule: the fee is charged per million of volume, per side, so a position opened and closed pays it twice. Rate USD 5 per million, as in the example.
| Notional copied in one position | Working | Fee on opening and closing (USD) |
|---|---|---|
| USD 100,000 | 0.1 × 5 × 2 | 1 |
| USD 1,000,000 | 1 × 5 × 2 | 10 |
| USD 5,000,000 | 5 × 5 × 2 | 50 |
Where the platform's share sits
From 4 July 2026 cTrader takes 30% of the fees the provider earns, deducted from the provider's side. In the page's example the provider earns USD 30, the platform takes USD 9 and the provider keeps USD 21. The investor pays no extra for it. The effect on a record is indirect: a provider who keeps less of the fees may set them differently. The pages do not say whether any did, and this site does not claim it.
In brief
Read next
Questions about how a record is made
Does a card's printed return include these fees?
The pages read do not say. Fees reach the provider's account as deposits, and how the printed figure treats deposits is on the ROI-calculation page, which this site did not read.
Which fees does a card charge?
The list pages show none. The "Start copying" button shows them, inside the application.
Is the management fee charged in a losing year?
Yes, by its definition: it is charged on equity regardless of the strategy's performance.
Can a provider change fees under a running copy?
The fees page says fees can be adjusted only after the strategy is stopped and no investors are copying it, and apply to investors who restart.
The broker this site links to
The site links to FxPro, which cTrader's list marks as a copy-enabled broker. A record is the provider's; the account a copy runs on is the follower's, and its result is a different document. Whether the copy service is open to a resident of Kenya is for FxPro to say.