
Bars against the curve
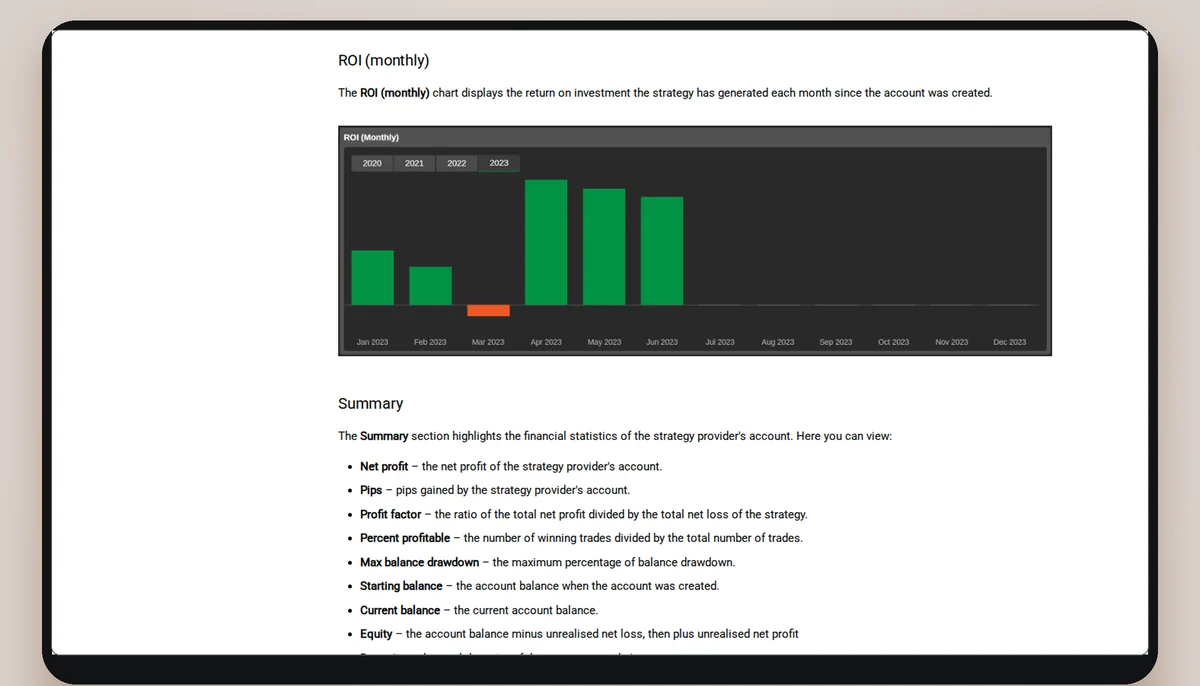
A strategy page carries several charts, and two of them answer different questions. One draws a bar per month; the others draw a line through time. This page quotes what the help pages say each chart is for, shows with made-up numbers what a bar leaves out, and then sets out the curve of each of the 20 cards, whose real values are in the saved pages.
What the help pages define
The ROI (monthly) chart "displays the return on investment the strategy has generated each month since the account was created". The ROI (%) chart plots time against ROI percentage, "in relation to the account balance the strategy had at the beginning of the period", with periods from one week to all time, updated daily. The equity chart "plots time on the X-axis and the cash value on the Y-axis" and, in the page's words, "is particularly important to understand the strategy risk factor and what drawdown can be expected". Those are statements of the help page (help.ctrader.com/ctrader-copy/account-and-strategy-page, read on 6 November 2026); this site repeats them as definitions and does not test the last one.
What one number per month leaves out
A bar is one value for a calendar month. It does not carry the order in which the month's gains and losses came, nor how deep the account fell on the way. Two accounts with the same bar can have taken very different paths to it, which the constructed table below shows with ten points: both end the month at +10, one never falls and the other falls 50 points from a high.
Two constructed paths that end on the same bar
A constructed illustration, not a card: the points are percentage points of an account and are made up to show what one number per month cannot carry. Both paths start at 0 and end at +10.
| Path | Week 1 | Week 2 | Week 3 | Week 4 | Month bar | Largest fall inside the month |
|---|---|---|---|---|---|---|
| A | +2 | +4 | +6 | +8 | +10 | none |
| B | +20 | −10 | +30 | −20 | +10 | 50 points |
What the cards' curves carry
Each card draws a line of 29 daily points. A line keeps the order, so a fall is visible. The window from 8 October 2026 to 5 November 2026 spans two calendar months, so it is not a month bar, and this site does not split it. The table lists every card's last value, lowest, highest and largest fall. 15 of the 20 ended above zero, 5 below, and 6 never dropped below an earlier high inside the window.
The 29-day curve of every card
Values are the points of the small curve each card draws, from 8 October 2026 to 5 November 2026, read from the saved page on 6 November 2026; the unit is the card's own and its base is not stated. 'Largest fall' is the biggest drop from a high point to a later low inside the window. Creation order.
| Strategy (provider) | End value | Lowest value | Highest value | Largest fall |
|---|---|---|---|---|
| Empire Trades (LogicFX) | +4.10 | 0.00 | +4.10 | 0.00 |
| The Deep Secret (ctid4925965) | -0.58 | -1.97 | +0.05 | -2.02 |
| PainGain cTrader (ToTheMoonRobot) | +3.91 | -3.64 | +3.91 | -3.88 |
| Diesel (ctid4925965) | +0.94 | -1.98 | +1.08 | -2.03 |
| CR7 (husseinalmoders) | -13.66 | -13.66 | +2.74 | -16.40 |
| SMART TRADER OM (ctid4925965) | +1.14 | -2.36 | +1.32 | -2.43 |
| Rostova (ctid4925965) | +1.12 | -2.35 | +1.30 | -2.41 |
| iloveyou (femaletrader131341) | +32.05 | +1.04 | +32.05 | -0.10 |
| BlackSignal (NeuroPhi) | +11.39 | -0.33 | +11.39 | 0.00 |
| WriggleX5 (RacerX5) | +42.89 | -14.99 | +42.89 | -36.79 |
| ProMax (M.fund) | +37.41 | -6.47 | +37.41 | -22.15 |
| ONE 9 (Aliyainvestments) | -4.30 | -6.74 | +0.01 | -6.75 |
| GOLD ORBIT (xauusdorbit) | +20.00 | +1.11 | +20.00 | 0.00 |
| GOLD MARS (xauusdmars) | +14.95 | +0.98 | +14.95 | -0.06 |
| Smartegy Trading (antoninsus21) | -0.75 | -0.75 | +0.39 | -1.14 |
| ONE (Aliyainvestments) | -3.66 | -11.00 | +0.02 | -11.02 |
| Less risk it more bisquit (EUFund) | +27.06 | +1.95 | +27.06 | 0.00 |
| Camel (Ethereum) | +112.71 | +4.03 | +112.71 | -3.11 |
| iloveyou so much (femaIetrader131341) | +78.71 | +3.62 | +78.71 | 0.00 |
| Method (Li5056) | +245.28 | +7.29 | +245.28 | 0.00 |
Ending above zero is not the whole story
Two cards ended the window above zero after a deep fall: WriggleX5 ended at +42.89 after a fall of 36.79; ProMax ended at +37.41 after a fall of 22.15. A bar for the window would show only the end. Another card, CR7 (husseinalmoders), ended below zero after a fall of 16.4. The window is short, the unit is the card's own, and none of this predicts a later window. It shows that the end and the path are two numbers.
Printed return beside age and the curve's end
The return is printed on the card; its period is not stated. A printed return is the provider's own record as the platform shows it; it is not an expectation and not a result for a reader. Age is counted to 6 November 2026; the end value is from the 29-day curve.
| Strategy | Age in days | Return as printed | Curve end |
|---|---|---|---|
| Empire Trades | 1,369 | 736% | +4.10 |
| The Deep Secret | 1,253 | 537% | -0.58 |
| PainGain cTrader | 1,243 | 1,364% | +3.91 |
| Diesel | 1,231 | 447% | +0.94 |
| CR7 | 1,063 | 5,159% | -13.66 |
| SMART TRADER OM | 650 | 427% | +1.14 |
| Rostova | 415 | 55% | +1.12 |
| iloveyou | 372 | 12,083% | +32.05 |
| BlackSignal | 247 | 406% | +11.39 |
| WriggleX5 | 235 | 18,411% | +42.89 |
| ProMax | 234 | 11,613% | +37.41 |
| ONE 9 | 221 | 15% | -4.30 |
| GOLD ORBIT | 210 | 1,138% | +20.00 |
| GOLD MARS | 210 | 502% | +14.95 |
| Smartegy Trading | 129 | -3% | -0.75 |
| ONE | 119 | -17% | -3.66 |
| Less risk it more bisquit | 79 | 259% | +27.06 |
| Camel | 76 | 1,428% | +112.71 |
| iloveyou so much | 64 | 113,998% | +78.71 |
| Method | 49 | 721% | +245.28 |
Why the printed return is read last
The return has no stated period; the symbol pages print an age label beside it, such as 2M or 3Y, which agrees with the creation dates, but no page says that the return covers that whole age. A figure with no stated period and no stated base cannot be compared with another card's, or with the curve, and the table sets them side by side only so that the difference is visible: a card two months old and a card three years old are in the same column.
In brief
Read next
Questions about how a record is made
Is a monthly bar wrong?
No. It is one value per month by definition. The question is what it leaves out.
Which chart shows the drawdown?
The equity chart, according to the help page, which calls it important for understanding the risk factor and the drawdown.
Can I compare two cards by their printed returns?
The period of each return is not stated on the pages read, so this site does not compare them.
Does the 29-day curve say what the next month will be?
No. It is a window of the past, used here to show path against end.
The broker this site links to
The site links to FxPro, which cTrader's list marks as a copy-enabled broker. A record is the provider's; the account a copy runs on is the follower's, and its result is a different document. Whether the copy service is open to a resident of Kenya is for FxPro to say.